Violin plot

A violin chart displays the distribution of a numeric variable, often for several groups of a dataset. This page is a step-by-step guide on how to build your own violin component for the web, using React and D3.js.
It starts by describing how the data should be organized and how to initialize the violin component. D3.js is then used to split the data in buckets thanks to the bin() function. It then adds smoothing to it with curve(). React is finally used to render the violin using a SVG path.
The Data 💾
The dataset used to build a violin chart is usually an array of object. For each object, a name property provides the group name, and a value property provides the numeric value. It looks like this:
const data = [
  { name: "A", value: 10.7577 },
  { name: "A", value: 19.9273 },
  { name: "B", value: 13.8917 },
  { name: "B", value: 0.5102 },
  { name: "C", value: 10.5524 },
  ...
]Note: violin plots are useful for big datasets. If you have less than ~100 data points, you probably better have to build a boxplot and add individual points on top.
Computing the distribution buckets
Each violin shape is actually almost the same thing as a histogram. To build it we first have to bin the numeric values of a group, which means creating buckets, assigning values to them and counting the number of elements per bin:
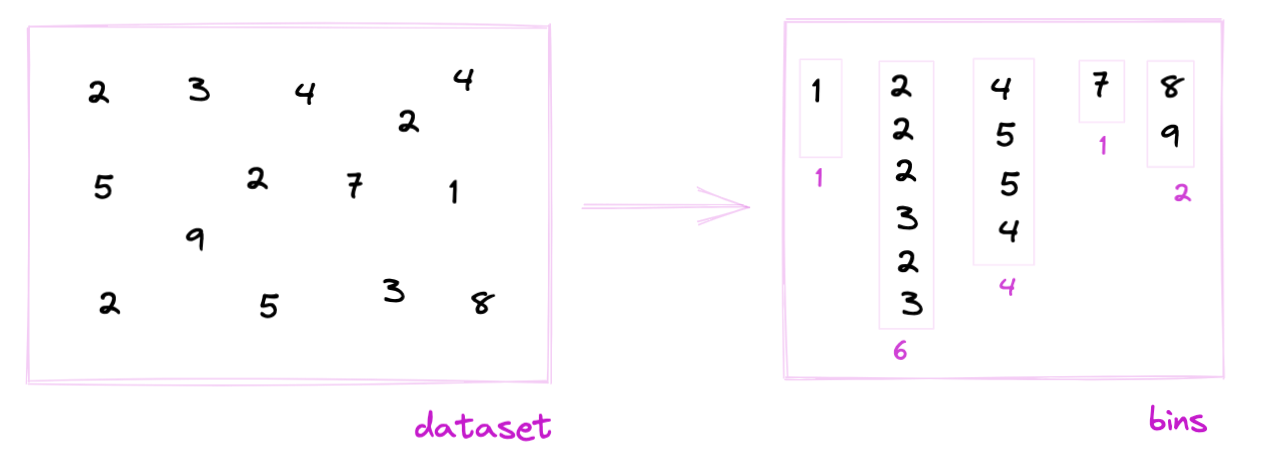
Binning is the process of dividing the range of values in a dataset into intervals, and then counting the number of values that fall into each interval.
I summarized the process to get those bins in the histogram binning section. I strongly advise to take a look before reading the rest of this blog post.
To put it in a nutshell, the bin() function is used to create a binGenerator. When data is passed to it, the result is an array where each item represents a bin:
[
  [x0: 0, x1: 2],
  [2, 2, 2, 3, x0: 2, x1: 4],
  [4, 5, x0: 4, x1: 6],
  [6, 6, 6, x0: 6, x1: 8],
  [x0: 8, x1: 10],
  [x0: 10, x1: 10],
]
Each array item is composed of all the values assigned to this bin. Itslength is the bucket size, i.e. the future violin width. Each bin has two additional attributes: x0 and x1 being the lower (inclusive) and upper (exclusive) bounds of the bin.
A reusable violin component 📦
The process to build a violin shape with d3.js is described in depth in the d3 graph gallery. Here is a summary and a reusable component:
→ build the svg path with d3.area() and curve()
The bins object computed above is all we need to draw an histogram since the lengthof each bin is the actual size of the bar. Drawing is possible thanks to the area() function that can be called as follow.
const areaBuilder = d3
  .area()
  .x0((d) => wScale(-d.length))
  .x1((d) => wScale(d.length))
  .y((d) => yScale(d.x0))
  .curve(d3.curveBumpY);
const area = areaBuilder(bins);
Note that the curve() function adds some smoothing to the shape, transforming the histogram in a smooth density.
→ render the path with react
The code above provides a string that is a SVG path. We can thus render it with react:
return (
  <path
    d={areaPath}
    opacity={1}
    stroke="#9a6fb0"
    fill="#9a6fb0"
    ...
  />
);
→ reusable component
You can wrap this logic in a component to get something reusable, that we will call for all groups of a dataset:
Demo of a VerticalViolin component allowing to draw a violin shape to represent the distribution of numeric values
Component skeleton
The goal here is to create a Violin component that will be stored in a Violin.tsx file. This component requires 3 props to render: a width, a height, and some data.
The shape of the data is described above. The width and height will be used to render an svg element in the DOM, in which we will insert the histogram.
To put it in a nutshell, that's the skeleton of our Violin component:
import * as d3 from "d3"; // we will need d3.js

type ViolinProps = {
  width: number;
  height: number;
  data: { group: string, value: number }[];
};

export const Violin = ({ width, height, data }: ViolinProps) => {

  // read the data
  // create Y Scale
  // For each group
    // create a violin shape
    // translate it to the x group position

  return (
    <div>
      <svg width={width} height={height}>
        // render all the violins
        // add axes
      </svg>
    </div>
  );
};
Scales and axes
→ Scales
Building a violin plot requires to transform a dimension (e.g. a numeric variable or a group name) in a position in pixels. This is done using a fundamental dataviz concept called scale.
D3.js comes with a handful set of predefined scales.
scaleLinearis what we need for the Y axis. It transforms a numeric value in a positionscaleBandis what we need for the X axis. It transforms a categoric variable (the groupnamehere) in a position
const scale = d3.scaleLinear()
  .domain([0, 10]) // data goes from 0 to 10
  .range([0, 200]); // axis goes from 0 to 200

scale(0); // 0 -> item with a value of 0 will be at the extreme left of the axis
scale(5); // 100 -> middle of the axis
scale(10); // 200 -> extreme rightconst xScale = useMemo(() => {
return d3
.scaleBand()
.range([0, boundsWidth])
.domain(allXGroups)
.padding(0.01);
}, [data, width]);
// xScale("A") -> 0
// xScale.bandwidth() -> 11To dig more into d3 scales, visit this dedicated page. It's a crucial concept that will be used everywhere in this website.
→ Axes
Axes are rather complicated elements. They are composed of the main segment, several ticks that each have a label, and are often decorated with a title.
Here I suggest creating the axes from scratch and storing them in 2 react components called AxisBottom and AxisLeft. Those components expect a d3 scale as input and do all the svg drawing for us.
Compute scales to map numeric values to a 2d canvas. Use custom react components to render axes with react from this scales.
The code for the Y axis components is provided below:
code for the Y axis react component
import { useMemo } from "react";
import { ScaleLinear } from "d3";

type AxisLeftProps = {
  yScale: ScaleLinear<number, number>;
  pixelsPerTick: number;
  width: number;
};

const TICK_LENGTH = 10;

export const AxisLeft = ({ yScale, pixelsPerTick, width }: AxisLeftProps) => {
  const range = yScale.range();

  const ticks = useMemo(() => {
    const height = range[0] - range[1];
    const numberOfTicksTarget = Math.floor(height / pixelsPerTick);

    return yScale.ticks(numberOfTicksTarget).map((value) => ({
      value,
      yOffset: yScale(value),
    }));
  }, [yScale]);

  return (
    <>
      {/* Ticks and labels */}
      {ticks.map(({ value, yOffset }) => (
        <g
          key={value}
          transform={"translate(0, {yOffset})"} // TODO struggling with back ticks
          shapeRendering={"crispEdges"}
        >
          <line
            x1={-TICK_LENGTH}
            x2={width + TICK_LENGTH}
            stroke="#D2D7D3"
            strokeWidth={0.5}
          />
          <text
            key={value}
            style={{
              fontSize: "10px",
              textAnchor: "middle",
              transform: "translateX(-20px)",
              fill: "#D2D7D3",
            }}
          >
            {value}
          </text>
        </g>
      ))}
    </>
  );
};
See the code of the graph below for the X axis implementation. I'll post an article dedicated to scales and axes in the near future.
First violin plot
Rendering is made thanks to the react jsx syntax. Each violin path is passed to a SVG path element in its d attribute.
Note that in the example below I'm using d3 to render the axes, not react. This will be discussed more in depth in a blogpost.
Responsive Violin with react
The component above is not responsive. It expects 2 props called width and height and will render a Violin of those dimensions.
Making the Violin responsive requires adding a wrapper component that gets the dimension of the parent div, and listening to a potential dimension change. This is possible thanks to a hook called useDimensions that will do the job for us.
useDimensions: a hook to make your viz responsive
export const useDimensions = (targetRef: React.RefObject<HTMLDivElement>) => {

  const getDimensions = () => {
    return {
      width: targetRef.current ? targetRef.current.offsetWidth : 0,
      height: targetRef.current ? targetRef.current.offsetHeight : 0
    };
  };

  const [dimensions, setDimensions] = useState(getDimensions);

  const handleResize = () => {
    setDimensions(getDimensions());
  };

  useEffect(() => {
    window.addEventListener("resize", handleResize);
    return () => window.removeEventListener("resize", handleResize);
  }, []);

  useLayoutEffect(() => {
    handleResize();
  }, []);

  return dimensions;
}Responsiveness is a deep topic.
The responsiveness module covers it in depth: the
useDimensions hook, the wrapper pattern, and the common pitfalls to avoid.Violin inspiration
If you're looking for inspiration to create your next Violin, note that dataviz-inspiration.com showcases many examples. Definitely the best place to get ... inspiration!
dataviz-inspiration.com showcases hundreds of stunning dataviz projects. Have a look to get some ideas on how to make your Violin looks good!
visitEffect of the bucket size
It's important to understand that under the hood, a violin shape is nothing else than a smoothed histogram. You can use the sentence below the following chart to switch from one to the other and understand the tight connection.
As a result the violin plot suffers the same flaw as the histogram: its shape highly depends on the number of buckets used for the computation. Use the slider to see the impact of the target bucket number on the violin shape.
Interactive violin plot: try to toggle smoothing and change the number of buckets in use.
Note: the requested number of buckets is a target. The bin() function of d3 will create smart buckets around this value.
Comparison with a boxplot
The boxplot is an alternative to represent the exact same kind of dataset. You can visit the boxplot section of the gallery or play with the interactive example below to understand how those 2 options behave on the same dataset.
Use the slider to switch from the violin to the box. Play with the sentence below the chart to toggle smoothing on the violin.
Compare how violins and boxplots look like for the same dataset.
Animation
Animating the transition between 2 datasets, or from/to another chart type is hard, because the violin plot is based on SVG path. It is doable though and I'm working on a specific post that will be released soon.
Using shape morphism to transition between a boxplot and a violin plot. Blog post coming soon!
If you're interested in this topic, feel free to subscribe to the newsletter to be informed when this post is available!


Contact
👋 Hey, I'm Yan and I'm currently working on this project!
Feedback is welcome ❤️. You can fill an issue on Github, drop me a message on LinkedIn, or even send me an email pasting yan.holtz.data with gmail.com. You can also subscribe to the newsletter to know when I publish more content!
