Boxplot

This tutorial is a variation around the general introduction to boxplot with react and d3.js. You should probably understand the concepts described there before reading here.
This example explains how to display all individual data points of the dataset on top of each box, using jittering to avoid overlaps.
A code sandbox is provided for the final result, but explanations target what's different compared to an usual boxplot.
Plot and code
If you are in a hurry, this is what we're trying to achieve here.🙇♂️
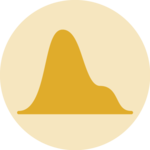
The distribution of several groups is represented, with one box for each group. This kind of viz is called a boxplot and has its own boxplot section.
Even if powerful to summarize the distribution of a numeric variable, the boxplot has flaws.
It basically hides the underlying distribution. For instance, a low sample size or a bi-modal distribution are impossible to detect reading the boxes only.
Jittering is a good workaround. Add all individual data points with low size, low opacity, and some random shift to the right or to the left (jitter). The underlying distribution becomes instantly available.
Showing individual data points using jittering on top of your boxplot adds trust. Reader now knows you're not hiding anything.
The Data
The dataset used here is exactly the same as the one used for the simple boxplot.
Jittering
We want to show each individual data point on top of each box for accuracy. If the dataset is big, this would result in a cluttered figure with a lot of overlap.
Jittering is a process that shifts each circle by a random value. It avoids the overlap, and allows to make the circle layer insightful.
Here is a suggestion to implement it:
const allCircles = groupData.map((value, i) => (
  <circle
    key={i}
    cx={
      xScale.bandwidth() / 2 -
      JITTER_WIDTH / 2 +
      Math.random() * JITTER_WIDTH
    }
    cy={yScale(value)}
    r={2}
    fill="grey"
    fillOpacity={0.3}
  />
));


Contact
👋 Hey, I'm Yan and I'm currently working on this project!
Feedback is welcome ❤️. You can fill an issue on Github, drop me a message on LinkedIn, or even send me an email pasting yan.holtz.data with gmail.com. You can also subscribe to the newsletter to know when I publish more content!
