Scatterplot tooltip: use Voronoi for closest point detection
This tutorial is a variation around the general introduction to scatterplot with react and d3.js. You should probably understand the concepts described there before reading here.
This example explains how to use an invisible Voronoi diagram in the background to detect the mouse closest point of the scatterplot.
A code sandbox is provided for the final result, but explanations target what's different compared to an usual scatter plot.
Plot and code
If you are in a hurry, this is what we're trying to achieve here.🙇♂️
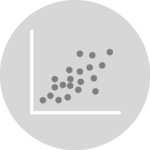
This is a scatterplot with voronoi detection. When you enter the chart area with your mouse, the closest point is found using a Delaunay triangulation. The corresponding circle is highlighted on the chart.
Same concept could easily be used to add a tooltip with great performance.
A scatterplot with tooltip. The closest point is detected using Voronoi to trigger the tooltip apparition.
The Data
The dataset used here is the same as for an usual scatterplot.
It is an array of objects where each object is a data point. The object can have many properties, but at least a x and a y prop are needed to provide the 2d coordinates.
Here is a minimal example of the data structure:
const data = [
  { x: 10, y: 10 },
  { x: 4, y: 4 },
  ...
];
Building the Voronoi diagram
The shapes drawn in the background are called a Voronoi diagram.
A voronoi diagram is a is a partition of a plane into regions called voronoi cells. A voronoi cell consists of every point in the plane whose distance to its linked data point is less than or equal to its distance to any other data point.
This is very handy to detect the mouse closest point on a scatterplot! 🔥
The react graph gallery has a dedicated section on the topic. Once you understood how Voronoi works with d3, it is just a matter of adding axes to get a scatterplot with point detection.


Contact
👋 Hey, I'm Yan and I'm currently working on this project!
Feedback is welcome ❤️. You can fill an issue on Github, drop me a message on LinkedIn, or even send me an email pasting yan.holtz.data with gmail.com. You can also subscribe to the newsletter to know when I publish more content!
