Horizontal Boxplot

This tutorial is a variation around the general introduction to boxplot with react and d3.js. You should probably understand the concepts described there before reading here.
The general introduction relies on a VerticalBox function that draws a.. vertical box 🙃. The main difference here is that we are now building a HorizontalBox function and swap the X and Y axes.
As usual, this post comes with explanation, a code sandbox and a template that you can reuse instantly in your web application.
Horizontal Boxplot implementation
Here is a proposal of implementation for a horizontal boxplot with react and d3.js.
D3 actually has a very minor role here. It is only used to compute the xand y scales. The x scale is a linear scale made with the scaleLinear() function. The Y scale shows groups thanks to the scaleBand() function.
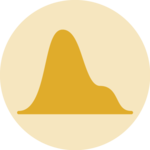
A horizontal boxplot made with React and D3.js.
Horizontal box drawing
We need a function that draws a horizontal box in SVG based on the quartiles position in pixels.
The function looks like this:
export const HorizontalBox = ({
  min,
  q1,
  median,
  q3,
  max,
  height,
  stroke,
  fill,
}: HorizontalBoxProps) => {
  return (
    <>
      <line
        y1={height / 2}
        y2={height / 2}
        x1={min}
        x2={max}
        stroke={stroke}
        width={STROKE_WIDTH}
      />
      <rect
        x={q1}
        y={0}
        width={q3 - q1}
        height={height}
        stroke={stroke}
        fill={fill}
      />
      <line
        y1={0}
        y2={height}
        x1={median}
        x2={median}
        stroke={stroke}
        width={STROKE_WIDTH}
      />
    </>
  );
};
Next steps
This post is a translation of the basic boxplot example, switching from vertical to horizontal mode.
Now that this basic horizontal boxplot is available, it should be straightforward to add interesting features like showing individual data points or switching to a violin plot.


Contact
👋 Hey, I'm Yan and I'm currently working on this project!
Feedback is welcome ❤️. You can fill an issue on Github, drop me a message on LinkedIn, or even send me an email pasting yan.holtz.data with gmail.com. You can also subscribe to the newsletter to know when I publish more content!
