Intro to Perlin noise
Perlin noise is a foundational concept in generative art, enabling the creation of organic, natural-looking randomness. Let’s explore what Perlin noise is, how it works in one dimension, and how you can use it in React.
What is Perlin Noise?
Perlin noise is a technique for generating smooth, pseudo-random values. It’s the secret behind many beautiful, naturally varying shapes and textures in generative art and computer graphics.
If you want a fantastic introduction, check out this video by The Coding Train—it explains Perlin noise better than words alone ever could!
Now, let’s see how to implement a simple Perlin noise example in React.
React Implementation
There’s a handy JavaScript library for Perlin noise called simplex-noise.
This library provides a createNoise2D function, which generates 2D Perlin noise. The first argument is the “offset”—the position where you sample the noise. If you use two nearby offsets, the resulting values will also be close, creating smooth transitions.
To simulate 1D Perlin noise, simply pass zero as the second argument.
const noise = createNoise2D();

noise(4, 0)       // returns 0.5
noise(4.00001, 0) // returns 0.5001

noise(10, 0)      // returns -0.4
For best results, create the noise generator inside a useMemo hook. This ensures the generator isn’t recreated on every render, so you get consistent noise values each time your component updates.
Visualizing Perlin Noise
Let’s loop through every pixel along the width of our chart—these will be our x-values.
For each pixel, we’ll calculate the corresponding noise value by incrementing the x offset by 0.01 each time. For example: noise(0, 0) for the first pixel, noise(0.01, 0) for the next, noise(0.02, 0) for the third, and so on. The output ranges from -1 to 1, which we’ll plot on the y-axis.
(Tip: Experiment with the x offset to see how it affects the smoothness of the noise!)
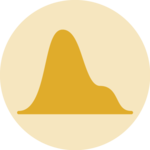
Simple Perlin noise visualization
Play with the X Offset
Now, let’s add some interactivity! We’ll again loop through all the pixels along the width, using each as an x-value for our line chart.
For each pixel, we’ll compute its noise value (between -1 and 1) and plot it on the y-axis. Try adjusting the x offset to see how the pattern shifts and evolves.
(Notice how changing the x offset changes the “texture” of the noise—this is a powerful tool for generative art!)
Basic Perlin noise
Here’s a suggestion for how you might implement this:


Contact
👋 Hey, I'm Yan and I'm currently working on this project!
Feedback is welcome ❤️. You can fill an issue on Github, drop me a message on LinkedIn, or even send me an email pasting yan.holtz.data with gmail.com. You can also subscribe to the newsletter to know when I publish more content!
