Vertical barplot

Bar charts are often better using horizontal bars and the gallery does a in-depth description on how to make them.
In some situation, the vertical barplot can still be a good option. If group labels are very short and can still be written horizontally, or if you're dealing with time related data.
Let's see how to make them using React and D3!
Plot and code
Here is a code sandbox in case you want to jump straight into the code.
Note that the gallery provides an in-depth description of the process leading to a barplot. This page will just highlight the differences for the vertical version!
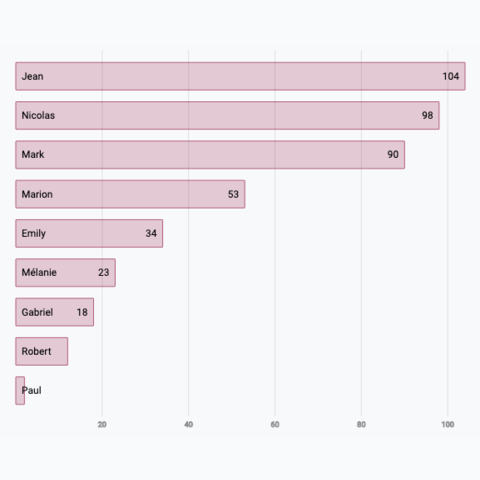
Basic vertical barplot made with React and D3.js
Deal with vertical rectangles
Vertical barplot are slightly more tricky to deal with than horizontal barplots.
Indeed, in SVG, rectangles are drawn from top to bottom. You provide a y argument that is the position of the top of the bar, and a height argument that tells how much lower the bar should go.
I strongly recommend to invert the domain argument of the yScale function:
const yScale = scaleLinear()
  .domain([max, 0])
  .range([0, boundsHeight]);
This way, the max value will be mapped to the top of the SVG area (0px), and the lowest values will be sent to the very bottom of the SVG area.
It also makes easy to find the value of the y argument of the rectangle: you just have to call the yScale with the bar value.
To find the rectangle height, you must use to total height of the graph and substract the bar value:
<rect
    x={x}
    y={yScale(d.value)}
    width={xScale.bandwidth()}
    height={boundsHeight - yScale(d.value)}
/>
Variation
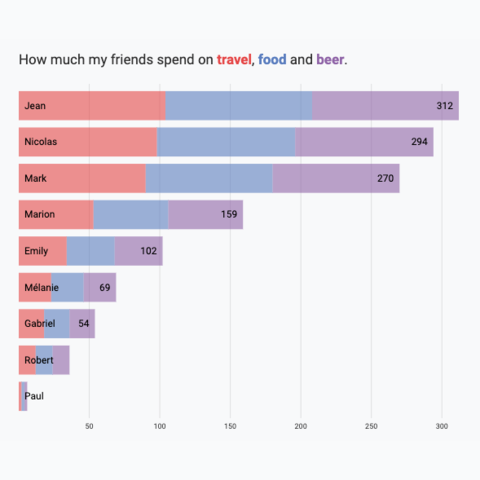
Check those other barplot and stacked barplot that can interest you:


Contact
👋 Hey, I'm Yan and I'm currently working on this project!
Feedback is welcome ❤️. You can fill an issue on Github, drop me a message on LinkedIn, or even send me an email pasting yan.holtz.data with gmail.com. You can also subscribe to the newsletter to know when I publish more content!
