Horizontal Stacked Barplot

This tutorial is a variation around the general introduction to barplot with react and d3.js. You should probably understand the concepts described there before digging into stacking.
This example shows how to represent 2 levels of grouping in a barplot, resulting in a stacked barplot. The items of the dataset are divided in groups (reprented as bars) and subgroups (represented as sections in each bar).
A code sandbox is provided for the final result, but explanations target what's different compared to an usual barplot.
Plot and code
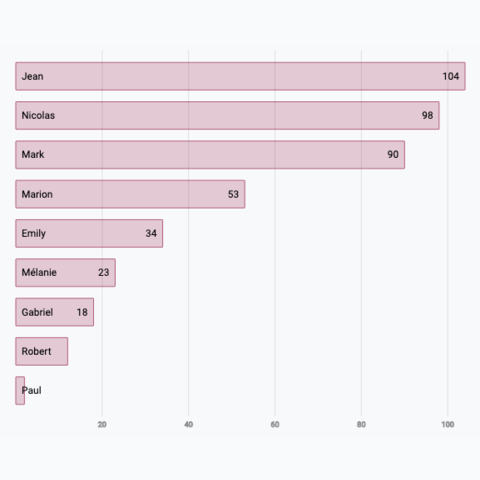
This is a stacked barplot built using React and d3.js. The dummy dataset provides information about how much my friends spent the last month. The people are the group here. Each bar represents a group.
A second level of grouping is available. We know if the money was spent on travel, food or beer. It is possible to represent this additional amount of info using a process called stacking.
A horizontal stacked barplot built with d3.js for scales, and react for rendering
Now, let's see how to implement such a graph.
The Data
There are several ways to store this information in javascript. I suggest an array of object where each object provides the valueof 1 specific expense, with the group (friend name) and the subgroup (category of expense).
export const data = [
  {group:"Mark", subgroup: "travel",  value: 90},
  {group:"Mark", subgroup: "food",  value: 23},
  {group:"Mark", subgroup: "beer",  value: 14},
  ...
]
Stacking
The trickiest part of the stacked barplot implementation is the stacking step.
Subgroups are displayed one next to each other. We need to compute their positions on the X axis. Fortunately d3.js is here to the rescue with a d3.stack() function.
→ Build a stack generator
d3.stack() constructs a stack generator. This stack generator is a function that takes a list of group names and will stack the data for each item.
This is how it can be applied to our dataset:
// You need the list of subgroups
const subGroups = ['travel', 'beer', 'food']

// Creates the stacking function
const stackGenerator = d3
  .stack<string>()
  .keys(subGroups)
  .value((d) => data.filter((item) => item.group === d)[0].value); // This is the accessor function: how to retrieve all values for a group
→ Use the generator
Now that this stack generator is available, we just have to run it on our list of group names to get the stacked values:
// Use the stack generator to stack the data in each group
const series = stackGenerator(groups);
→ Output
The output has kind of an usual shape and it's important to understand how it's formatted. It's an array with the same length than the initial dataset. Once more, each item is linked to a positon on the x axis.
Each item is an array of length 2, associated with a specific series. This is a mess to explain.
[
  // Subgroup 1 (travel)
  [
    [0, 90, data: 'Mark'], // subgroup travel goes from x=0 to x=90 for Mark
    [0, 12, data: 'Robert'],
    [0, 34, data: 'Emily'],
    ...
  ],
  // Subgroup 2 (food)
  [
    [90, 180, data: 'Mark'], // subgroup food goes from x=90 to x=180 for Mark
    [12, 24, data: 'Robert'],
    [34, 68, data: 'Emily'],
    ...
  ]
]
Rendering
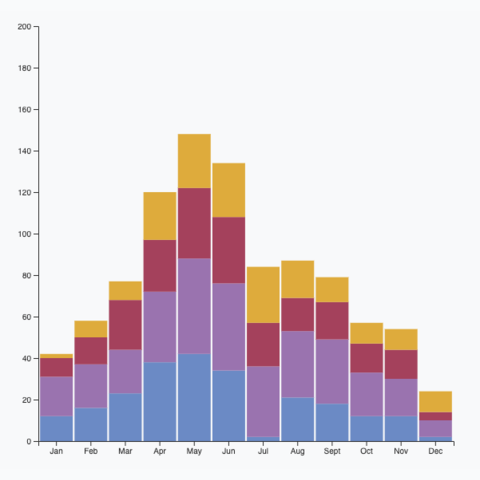
Once you get the stacked data above, rendering the chart is business as usual. You can loop through the object and plot a rect for each item.
A horizontal stacked barplot built with d3.js for scales, and react for rendering
Variation
Check those other barplot and stacked barplot that can interest you:


Contact
👋 Hey, I'm Yan and I'm currently working on this project!
Feedback is welcome ❤️. You can fill an issue on Github, drop me a message on LinkedIn, or even send me an email pasting yan.holtz.data with gmail.com. You can also subscribe to the newsletter to know when I publish more content!
