Lollipop plot

A lollipop plot is a variation of the more common barplot. This page is a step-by-step guide on how to build your own lollipop for the web, using React and D3.js.
It starts by describing how the data should be organized and how to initialize the lollipop component. It explains how to build the scales and axes and how to add the shapes. A few variations are described and a focus is made on the hover interaction. 🙇♂️.
The Data
The dataset required to build a lollipop is usually an array where each item is an object providing the name and the value of the group.
Here is a minimal example:
const data = [
  {name:"Mark", value: 90},
  {name:"Robert", value: 12},
  {name:"Emily", value: 34},
  {name:"Marion", value: 53},
  {name:"Nicolas", value: 98},
]
Note: if your data is in .csv format, you can translate it thanks to the d3.csv() function as suggested here.
Component skeleton
The goal here is to create a Lollipop component that will be stored in a Lollipop.tsx file. This component requires 3 props to render: a width, a height, and some data.
The shape of the data is described above. The width and height will be used to render an svg element in the DOM, in which we will insert the histogram.
To put it in a nutshell, that's the skeleton of our Lollipop component:
import * as d3 from "d3"; // we will need d3.js

type LollipopProps = {
  width: number;
  height: number;
  data: number[];
};

export const Lollipop = ({ width, height, data }: LollipopProps) => {

  // read the data
  // build the scales
  // build the lines and circles

  return (
    <div>
      <svg width={width} height={height}>
        // render axes
        // render all the lines and rects
      </svg>
    </div>
  );
};
It's fundamental to understand that with this code organization, d3.js will be used to prepare the SVG circle, but it's React that will render them in the return() statement. We won't use d3 methods like append that you can find in usual d3.js examples.
Most basic lollipop
A lollipop chart is a variation of the better known barplot. The implementation of a barplot with react is extensively described in the barplot section of the gallery. So I will just provide a quick recap here.
To put it in a nutshell, 2 scales must be created. The x axis transforms a numeric value in a position in pixel: it is a linear scale built with the scaleLinear() function of d3. The y axis transforms a group name in a position in pixel: it is a band scale built with scaleBand().
Once the scales are available, loop through each item of the dataset. Instead of drawing a rectangle for each item, draw a line and a circle. Instead of adding a proper X and Y axes, I suggest to create a grid manually and to draw labels at an arbitrary position.
Most basic Lollipop built with d3.js for scales, and react for rendering
Responsive Lollipop with react
The component above is not responsive. It expects 2 props called width and height and will render a Lollipop of those dimensions.
Making the Lollipop responsive requires adding a wrapper component that gets the dimension of the parent div, and listening to a potential dimension change. This is possible thanks to a hook called useDimensions that will do the job for us.
useDimensions: a hook to make your viz responsive
export const useDimensions = (targetRef: React.RefObject<HTMLDivElement>) => {

  const getDimensions = () => {
    return {
      width: targetRef.current ? targetRef.current.offsetWidth : 0,
      height: targetRef.current ? targetRef.current.offsetHeight : 0
    };
  };

  const [dimensions, setDimensions] = useState(getDimensions);

  const handleResize = () => {
    setDimensions(getDimensions());
  };

  useEffect(() => {
    window.addEventListener("resize", handleResize);
    return () => window.removeEventListener("resize", handleResize);
  }, []);

  useLayoutEffect(() => {
    handleResize();
  }, []);

  return dimensions;
}Responsiveness is a deep topic.
The responsiveness module covers it in depth: the
useDimensions hook, the wrapper pattern, and the common pitfalls to avoid.Lollipop inspiration
If you're looking for inspiration to create your next Lollipop, note that dataviz-inspiration.com showcases many examples. Definitely the best place to get ... inspiration!
dataviz-inspiration.com showcases hundreds of stunning dataviz projects. Have a look to get some ideas on how to make your Lollipop looks good!
visitDumbbel plot
A dumbbell plot, also known as a cleveland plot or a connected dot plot, is a visual representation of the difference or change between two related variables. It consists of two endpoints, represented by circles or dots, connected by a horizontal line, which represents the magnitude of the difference or change.
This type of plot is commonly used in scientific research to display the effect of an intervention or treatment on a particular outcome, or to compare two different groups or time periods. The plot allows for easy comparison of the magnitude and direction of change between the two variables.
The implementation is very close to the basic lollipop chart described above. The dataset provides 2 data points for each item in the dataset: value1 and value2. The scales and axes are exactly the same. Instead of drawing 1 line and 1 circle, 2 circles are joined by the line.
A basic yet clean dumbbell plot built with d3.js and React
Hover effect
The circles can be quite far from their label for the biggest values on the chart (see Mark below). Adding an hover interaction on the lollipop charts allows to highlight a specific row. As a result, the label/data point connection becomes more obvious.
There are various strategies to implement such an hover effect. Here, I suggest to do everything in css using pseudo classes, and targetting svg elements only.
Two different things happen when a row is hovered:
- All other rows are faded out. Their
opacityis lowered to.3 - A grey rectangle that wraps the row is drawn.
→ For the first effect, a rowsContainer class is added to the element that wraps all rows. When it is hovered hover (rowsContainer:hover), everything that's inside it has a lower opacity. But a specific rule is added at the hovered row level to keep it with a strong opacity. To put it in a nutshell, css looks like:
/* Row has an opacity of 1 by default */
.row {
  opacity: 1;
  cursor: pointer;
}

/* But if the container is hovered somewhere, opacity is decreased to .3 */
.rowsContainer:hover .row {
  opacity: 0.3;
}

/* Except for the specific row that is hovered hover that keeps its opacity to 1 */
.rowsContainer .row:hover {
  opacity: 1;
}
→ For the second effect, 2 svg rectangles must be drawn. The first one fills the full width and height of the row. It is the one that triggers the mouse event. (It is important to remember that a svg g element does not trigger mouse events. Only what is drawn inside it does). The second rectangle is the one that we see. We can add some vertical padding to it since it is not use for mouse detection.
Try to hover a row in the lollipop above to reveal the hover interaction.
Data transition
It is very common to deal with various variables and compare the behaviour of some data items for them. It adds a nice touch to the graph to smoothly transition between 2 states using a quick animation.
For the example below I rely on the react-spring library. This lib allows to quickly create spring animations using javascript. It results in a very a natural transition that can be interrupted without restarting from 0. (try to toggle between datasets quickly).
It would be too long to explain the code here. Instead, I'm currently writing a set of dedicated tutorials. Please subscribe to the newsletter to know when this will be released.
A lollipop chart with smooth transition between dataset.
Variation
Check a few other examples of the gallery involving lollipop plots:
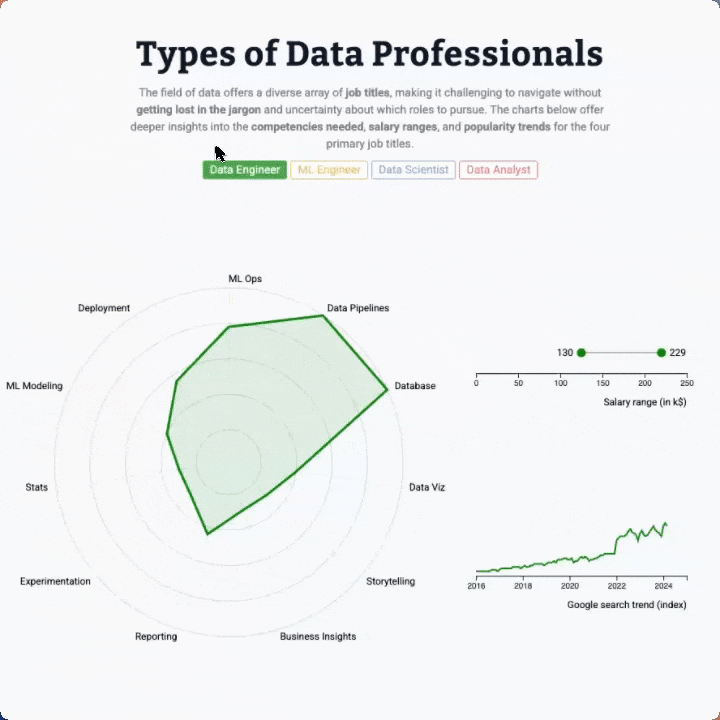
Radar chart, line chart an lollipop with animated transition
Three charts connected to same buttons, with smooth, synchronized animation when a button is clicked


Contact
👋 Hey, I'm Yan and I'm currently working on this project!
Feedback is welcome ❤️. You can fill an issue on Github, drop me a message on LinkedIn, or even send me an email pasting yan.holtz.data with gmail.com. You can also subscribe to the newsletter to know when I publish more content!
