Vertical Stacked Barplot

This tutorial is a variation around the general introduction to barplot with react and d3.js. You should probably understand the concepts described there before digging into stacking.
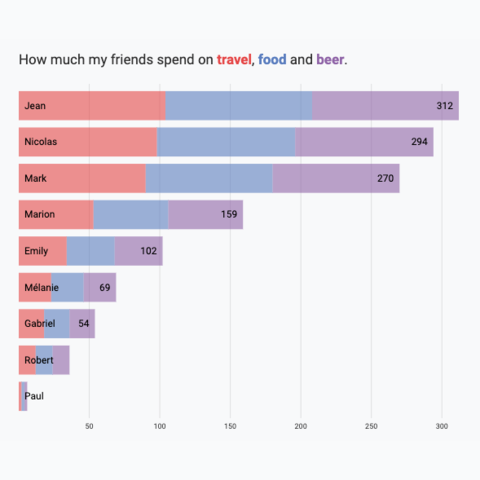
This example shows how to represent 2 levels of grouping in a barplot, resulting in a stacked barplot. The items of the dataset are divided in groups (reprented as bars) and subgroups (represented as sections in each bar).
A code sandbox is provided for the final result, but explanations target what's different compared to an usual barplot.
Plot and code
This is a vertical stacked barplot built using React and d3.js. It is very similar to the horizontal version. So very little explanation is provided here. Enjoy the sandbox!
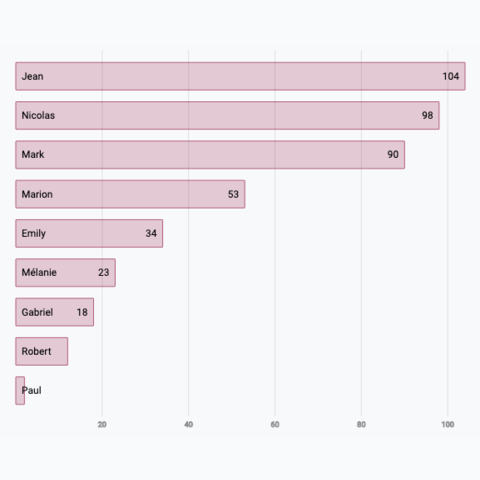
Most basic barplot built with d3.js for scales, and react for rendering
Variation
Check those other barplot and stacked barplot that can interest you:


Contact
👋 Hey, I'm Yan and I'm currently working on this project!
Feedback is welcome ❤️. You can fill an issue on Github, drop me a message on LinkedIn, or even send me an email pasting yan.holtz.data with gmail.com. You can also subscribe to the newsletter to know when I publish more content!
