Welcome to the Web (dev)
Web development is a vast field. Let me start by welcoming you here — I'll do my best to make you love it as much as I do.
The goal of this lesson is to build a mental map of what you need to know before creating charts in a webpage. Having this big picture first will help everything else click into place.
This module is designed for people with little or no experience in web development. Already comfortable with HTML, CSS, JavaScript, and GitHub? Feel free to skip ahead to the next module!
👋 Welcome!
Welcome to the course — and to the wonderful world of front-end development and data visualization!
I come from the data analysis world, where I spent years working with R and Python. When I discovered what's possible with D3.js and React about 10 years ago, it completely blew my mind.
But I won't lie: it took me forever to learn everything. The ecosystem was overwhelming, tutorials were scattered, and I made every mistake in the book.
Today, I'm hoping to make your journey much smoother. You have this course, the tools are better than ever, and AI is here to help you move faster.
Eventually, you'll build charts like these. But first, you need to understand how the web actually works.
Real life use-case
Reproduction of a data wrapper chart representing countries CO2 data

Boxplot to Violin plot
Interactive example showing the difference between a boxplot and a violin
Population Pyramid
A very customized version of a population pyramid
Population Pyramid
A very customized version of a population pyramid
Bin size slider
See the effect of bin size on a histogram with this interactive example
Radar chart, line chart an lollipop with animated transition
Three charts connected to same buttons, with smooth, synchronized animation when a button is clicked
Hover effect
Treemap with hover effect to highlight a group
Streamgraph application
Streamgraph with a slider to zoom on a time stamp and with interactive inline legends
🗺️ The big picture
Before jumping into code, you need a mental model of how everything fits together. What are the pieces? How do they connect? What are the related tools?
Here's my attempt to summarize the key concepts (in blue), programming languages (in purple), and the tools used to work with them (in orange).
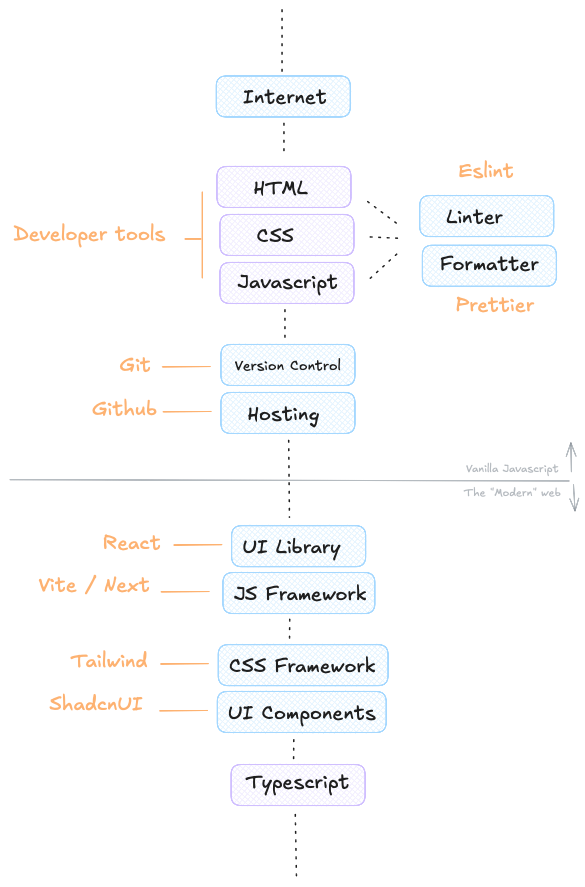
Everything starts with the 3 core languages: HTML, CSS, and JavaScript. We'll cover them in the upcoming lessons — just enough to give you a solid foundation. With these three alone, you can already build stunning websites.
This first module also introduces essential developer skills: version control with Git and GitHub, linters, and formatters.
Later, in the second module, we'll move on to the "modern" web — learning React and powerful frameworks. But let's not get ahead of ourselves.
Oh no! 😱
It seems like you haven't enrolled in the course yet!
This is a lesson from the D3 ❤️ React course, where you learn to create bespoke, interactive graphs with d3.js and React.
Enrollment is currently closed. Join the waitlist to be notified when doors reopen:
Or Login