Tooltip component
The previous lesson introduced the general strategy to build tooltips in HTML. This lesson explains how to build a small but reusable Tooltip component.
Let's find out the main steps: the overlay layer, the interactionData prop, and a bit of CSS to tie it all together.
What we're building
Here is the tooltip we'll build in this lesson.
For now, it's stuck in place next to a single circle. In the next lesson, we'll make it appear only when the user hovers over a graph element.
import { Tooltip } from "./Tooltip";
import "./styles.css";

const width = 500;
const height = 300;

export default function App() {
  return (
    <div style={{ position: "relative" }}>
      {/* SVG layer */}
      <svg width={width} height={height}>
        <circle cx={width / 2} cy={height / 2} r={30} fill="#4e79a7" />
      </svg>

      {/* Tooltip layer */}
      <div
        style={{
          position: "absolute",
          width,
          height,
          top: 0,
          left: 0,
          pointerEvents: "none",
        }}
      >
        <Tooltip
          interactionData={{
            xPos: width / 2,
            yPos: height / 2,
            name: "Hello tooltip",
            xValue: width / 2,
            yValue: height / 2,
            color: "#4e79a7",
          }}
        />
      </div>
    </div>
  );
}
A minimal tooltip, always visible. We'll add the "only on hover" logic in the next lesson.
How it works: 5 small pieces
A reusable tooltip is just five pieces snapped together. Let's walk through them one at a time.
1️⃣ The tooltip sits on top of the graph
Remember from the previous lesson: we don't build tooltips in SVG, we use HTML. The whole pattern rests on one simple idea.
We render an HTML div that exactly overlaps the SVG area: same width, same height, pinned to the same top-left corner.
Once the two layers share the same coordinate system, positioning becomes trivial. A tooltip placed at left: 250, top: 150 in the overlay lands right on top of whatever SVG shape was drawn at cx=250, cy=150.
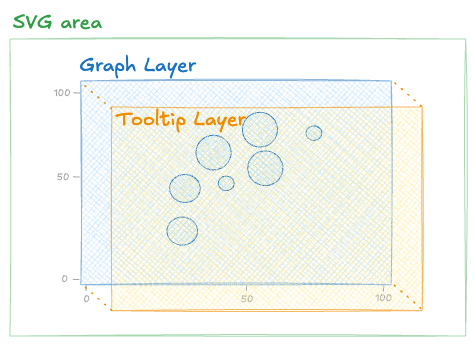
An SVG layer for the chart, and an HTML layer on top for the tooltip.
2️⃣ The overlay div
Here's how to build that two-layer structure. An outer div with position: relative wraps both layers. The SVG is rendered as usual, and a sibling div uses position: absolute with matching dimensions to sit exactly on top:
Oh no! 😱
It seems like you haven't enrolled in the course yet!
This is a lesson from the D3 ❤️ React course, where you learn to create bespoke, interactive graphs with d3.js and React.
Enrollment is currently closed. Join the waitlist to be notified when doors reopen:
Or Login