Other scale types
While scaleLinear is one of the most commonly used D3 scales, other scale types are essential for creating even basic charts.
Let's explore scaleBand, scaleSqrt, and other indispensable scale functions!
scaleBand() to create... bands
scaleBand() is ideal for categorical variables as it allocates equal space for each category, ensuring that every discrete value is uniformly represented on the axis.
Example
You want to create a horizontal bar chart with 3 bars in a figure that is 240 pixels high. You want to dedicate a percentage of the total height for white space: this is the padding between bars.
To build such a barplot, you need to figure out all the dimensions outlined below:
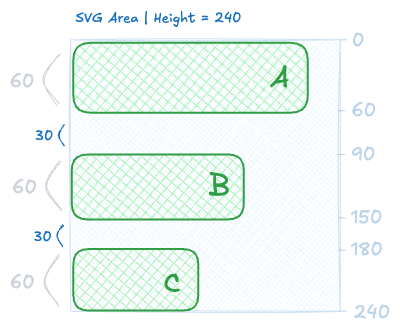
All the numbers produced by the scaleBand() function.
Fortunately, this can be computed by D3 using the scaleBand() function! It expects the following:
There are many ways to control the padding. The official doc explains very well!
- The
domainis an array that lists the groups. - The
rangeis a two-element array that specifies the pixel positions where the shapes will be drawn. - The optional
paddingmethod is expressed as a fraction of the band width.
const yScale = d3.scaleBand()
  .domain(['A', 'B', 'C'])
  .range([0, height])
  .padding(0.1)
Now that this scale is available, you can use it to get all the necessary positions 🎉!
Note that when you call the scale function on a group, it is the start of the corresponding band that is returned.
// Top of each bar:
console.log(yScale('A')); // 0
console.log(yScale('B')); // 90
console.log(yScale('C')); // 180

// Width of a bar:
console.log(yScale.bandwidth()); // 60
Let's do a barplot!
With this new scale function, we have all the numbers we need to make a barplot! Let me show you how, with a special mention for the bandwidth method:
How bandwidth() works with scaleBand().
Oh no! 😱
It seems like you haven't enrolled in the course yet!
This is a lesson from the D3 ❤️ React course, where you learn to create bespoke, interactive graphs with d3.js and React.
Enrollment is currently closed. Join the waitlist to be notified when doors reopen:
Or Login