Initial setup
Creating graphs in a React environment using D3.js can be quite complex.
Here’s a list of tools I highly recommend to simplify your journey in building a dataviz web application. 🔧
1️⃣ React: Use a Framework
React is a JavaScript library, not a framework.
Several frameworks are built on top of it to manage common requirements such as routing, static page generation, server-side rendering, and more.
Personally, I'm a huge fan of Next.js, but other options like Gatsby, Remix, or even sticking with Create React App are excellent choices as well!
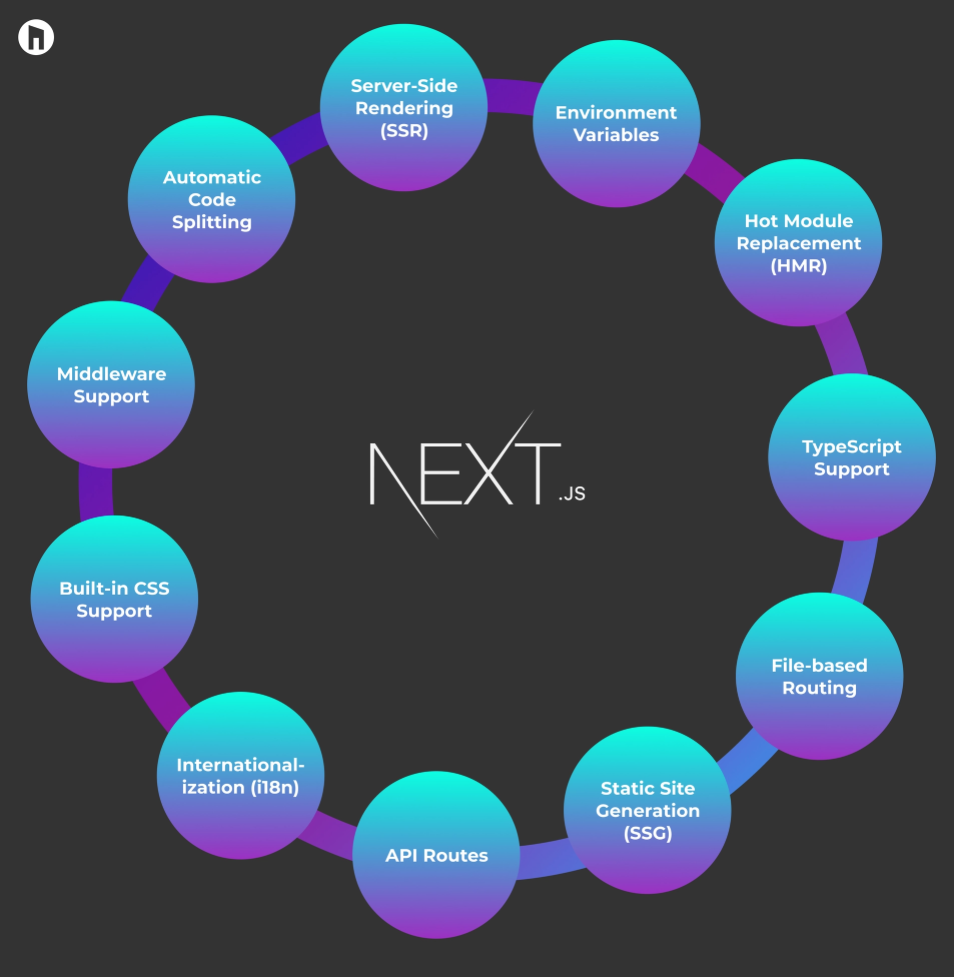
List of next.js features that will make your life easier. Source.
2️⃣ D3.js: Load What You Need
D3.js is not a monolithic library but a collection of around 30 discrete modules.
You don’t need to install and load the entire D3.js library for your work; it's likely that you'll only use a fraction of its capabilities.
For example, if you need to work with scales, you can simply install the d3-scale module using npm install d3-scale
and utilize only the functions you require from it!
// import the scaleLinear function from the d3-scale module
import { scaleLinear } from "d3";
// Use it in your code
cons xScale = scaleLinear()
3️⃣ Typescript: your best friend
TypeScript is like a special version of JavaScript that helps you write better code by letting you add labels to your variables. These labels, or "types," tell you what kind of data you're working with, like number
or string
.
This way, if you make a mistake, TypeScript can help you catch it before you run your program, making it easier to fix problems and build bigger projects!
I strongly advise to learn and use typescript. I'll use it in this course, but you do not have to if you do not want to.
D3.js & Typescript
Fortunately, DefinitelyTyped provides the types of all d3.js functions and objects! So you can install all the types we'll need with:
npm install --save @types/d3
4️⃣ Save Time with a Boilerplate
I'm a big fan of Tailwind CSS for styling and ShadCn/UI as a UI component library.
If you like those tools too, check out my boilerplate! This repository is a minimal project with all the tools mentioned in this lesson already installed. Just clone it, run npm run dev
, and you’ll have a working environment that looks like this right away:
Overview of my dataviz project boilerplate. Use next.js + d3 + tailwind + typescript + shadcn/UI in 2 minutes. .
✌️ No Worries!
Don’t want to install any of those tools? No worries!
All the lessons in this course feature interactive sandboxes, allowing you to learn and experiment without ever leaving this website!
Here is an example with a basic barplot you can edit by clicking on the "see code" button:
Most basic barplot built with d3.js for scales, and react for rendering
Now, let’s start creating some dataviz magic on that screen, shall we?