Hover interaction on a chart with React
Interactivity is crucial in data visualization, especially for web applications. Adding hover effects enhances user experience by highlighting specific series on the chart.
This post suggests a few strategies to implement hover effects using css and react.
Note: this article does not talk about tooltips that has its dedicated section.
4️⃣ Internal state & event listener
Add onMouseEnter event listener to all circle
Set an internal state
Trigger a redraw of all circles with conditional state.
As for the tooltip example above, everything starts with an internal state (called hoveredGroup) that stores which circle is hovered hover.
const [hoveredGroup, setHoveredGroup] = useState<string | null>(null);Now, this state needs to be updated when a user hovers over the circle. setHoveredGroup can be passed as a callback to the onMouseOver attribute of each circle.
On top of this, some specific css classes can be attributed to circles depending on the circle that is hovered hover. In the example above, a class called dimmed is added to circles that must disappear.
To put it in a nutshell, the circles are created as follows:
const allShapes = data.map((d, i) => {
  const className = // class if the circle depends on the hover state
    hoveredGroup && d.group !== hoveredGroup
      ? styles.scatterplotCircle + " " + styles.dimmed
      : styles.scatterplotCircle;

  return (
    <circle
      key={i}
      r={5}
      cx={xScale(d.x)}
      cy={yScale(d.y)}
      className={className} // class is attributed here
      stroke={colorScale(d.group)}
      fill={colorScale(d.group)}
      onMouseOver={() => setHoveredGroup(d.group)} // callback to update the state
      onMouseLeave={() => setHoveredGroup(null)} // and to set it back to null
    />
  );
});
Last but not least, some css needs to be added to customize the circle depending on if they are in default, .dimmed or :hover mode.
Note that the filter: saturate(0) is a good way to dim unwanted circles. Also, playing with transition-delay and transition-duration adds to animate the transition is a nice touch you should consider. Check the code below the example to see the full css.
TODO.
- Allows to sync the hover effect with other UI updates. The hovered state can be used to update any other react components in the application. Like tooltip or another graph.
- Using javascript to trigger the animation can give more flexibility to customize the hover effect, using react-spring for instance.
- Performance 🚨. Here we are redrawing all the circles each time a hover effect is hovered. This can be dramatic if you have thousands of circles!

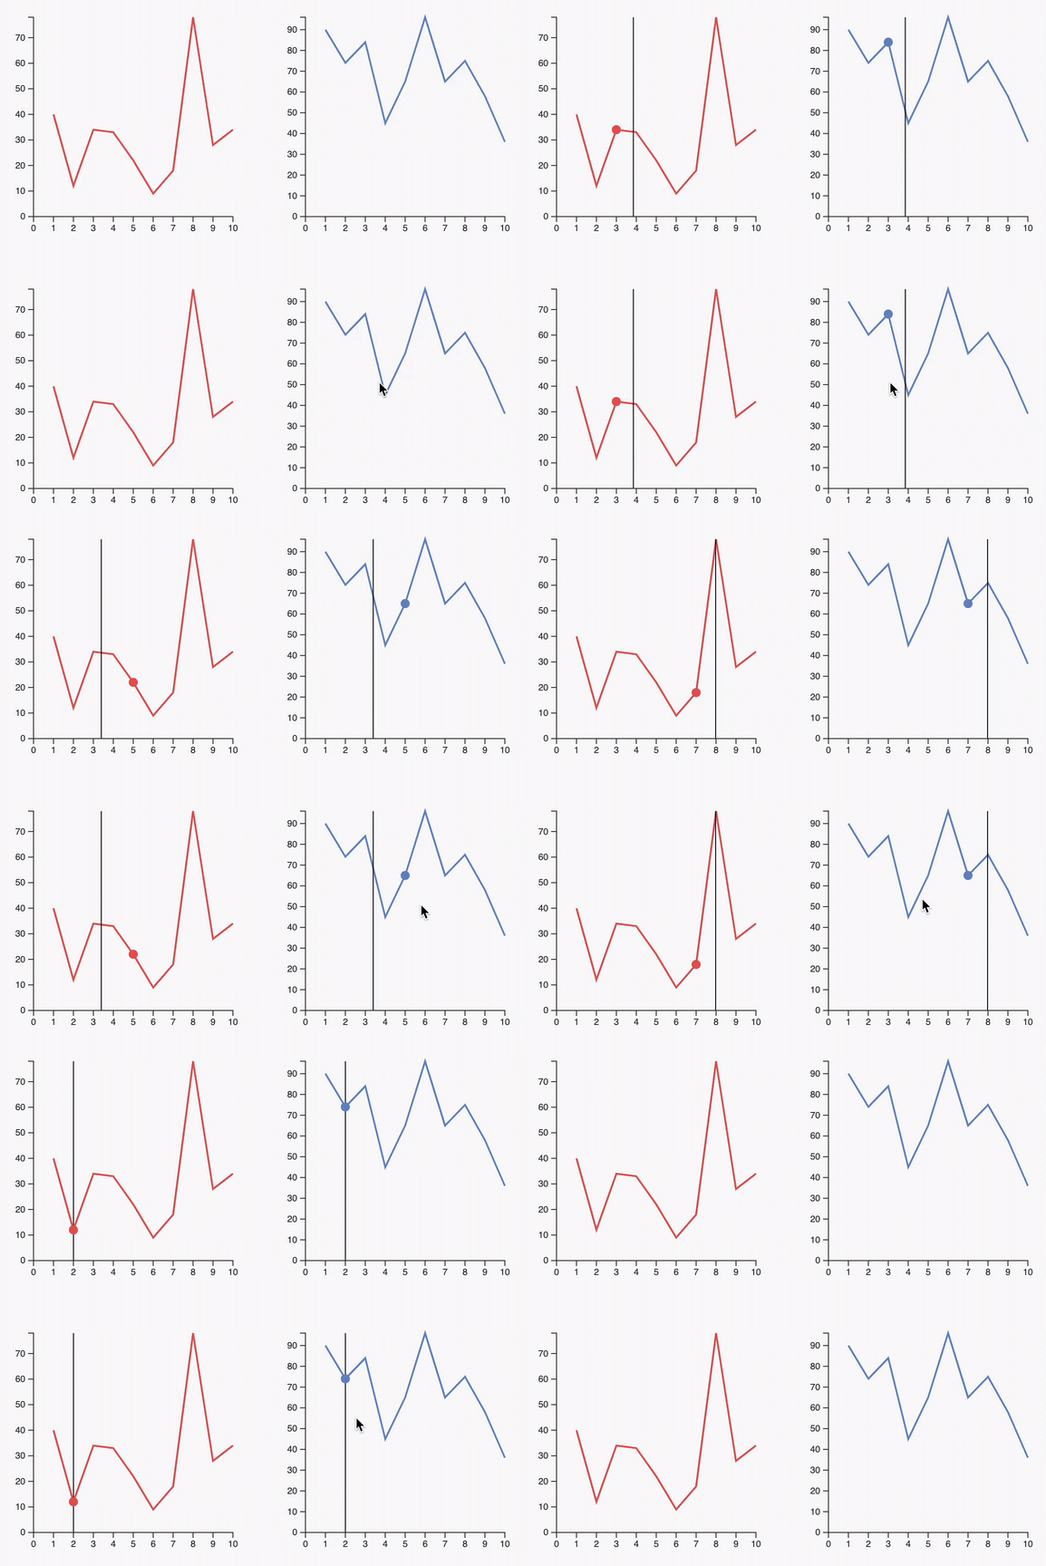
Synchronized cursors
Add a cursor synchronized on all your charts

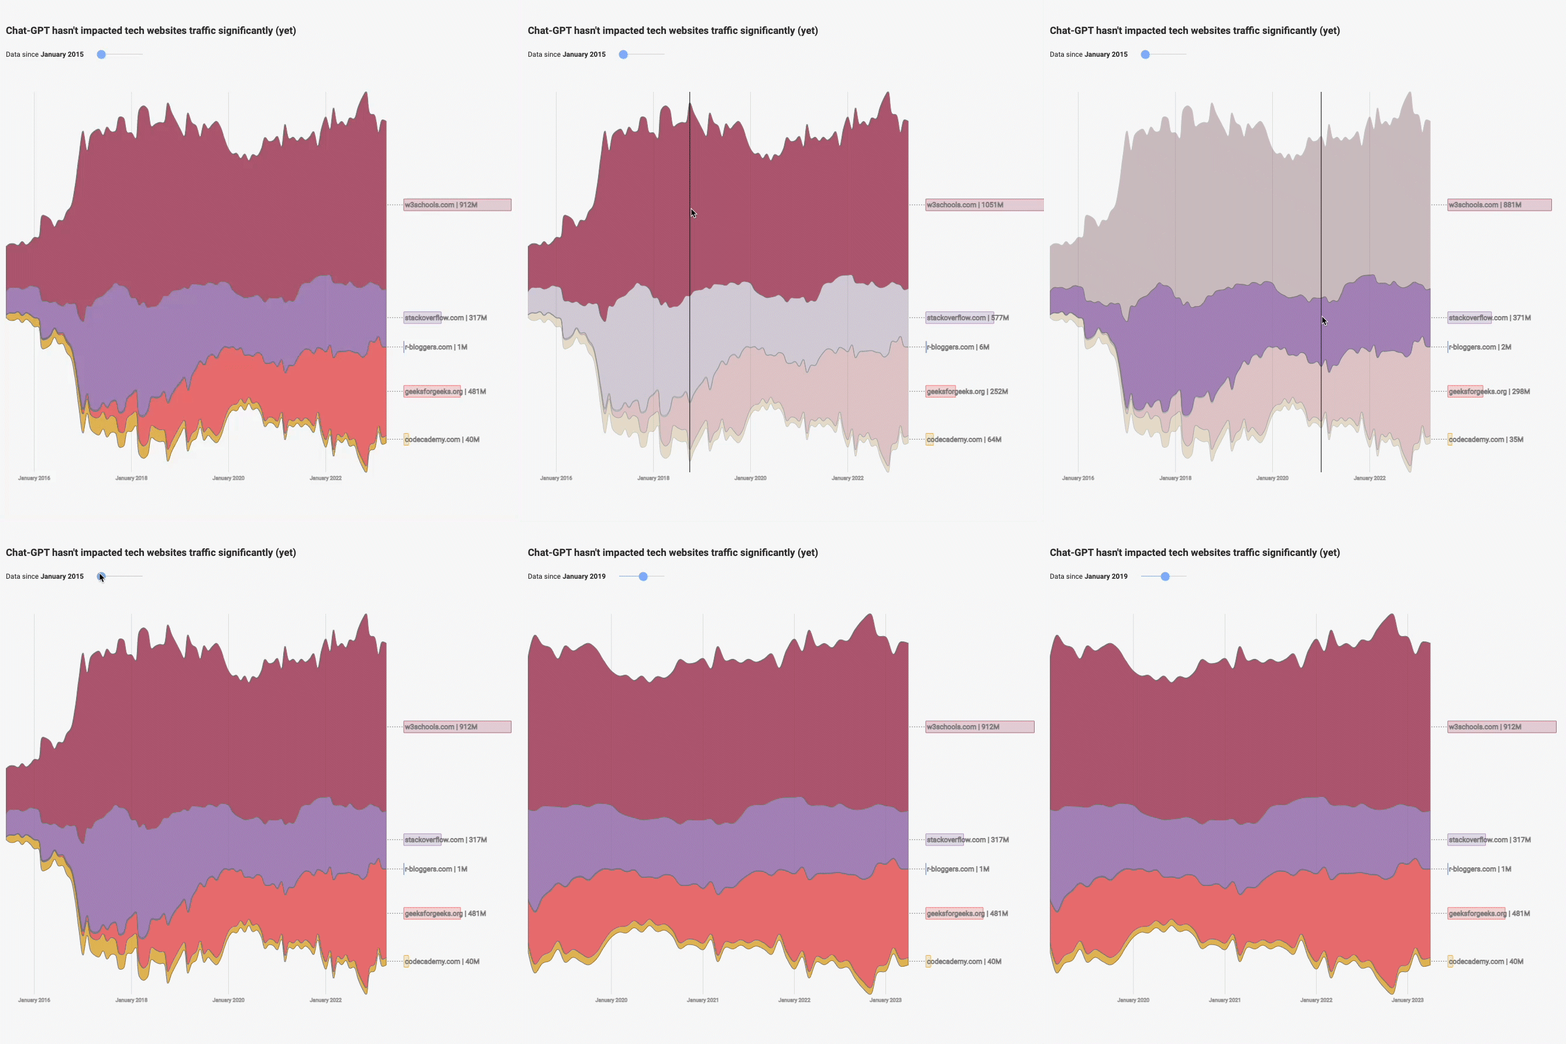
Streamgraph application
Streamgraph with a slider to zoom on a time stamp and with interactive inline legends
4️⃣ Canvas
Using the useDimensions hook described above is pretty straight-forward. You first need to create a ref using the react useRef()function:
Use dimming to highlight a specific point
General Knowledge
Contact
👋 Hey, I'm Yan and I'm currently working on this project!
Feedback is welcome ❤️. You can fill an issue on Github, drop me a message on Twitter, or even send me an email pasting yan.holtz.data with gmail.com. You can also subscribe to the newsletter to know when I publish more content!


