Combining SVG and canvas
The previous lesson taught you how to draw shapes with canvas. It's fast, but we're still far from a real chart.
Now it's time to add the elements that turn a few shapes into a graph: axes, titles, tooltips. Let's mix canvas with SVG and HTML to get the best of each world.
❌ Canvas only? Nope!
In the previous lesson, we learned how to loop through a dataset and render a circle for each item. This is very close to creating a bubble chart!
But what about the other elements: axes, annotations, titles, tooltips?
It would be incredibly tedious to build them with canvas too, and they don't pose any performance challenge anyway. So it's better to stick to what we already know and use HTML and SVG for them!
Only one challenge remains: how do we mix these two paradigms together?
🍔 Stacking Canvas and SVG
In earlier modules, we explored how to add margins around the chart area and created reusable axis components to define the x and y scales.
The great news is that we can seamlessly combine both canvas and SVG, since, at the core, they're both HTML elements!
Our graph component will look like this. We'll superimpose layers, each built using its own technology:
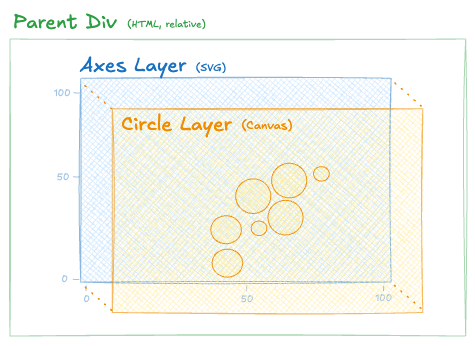
How to overlap SVG and Canvas layers to create a bubble plot.
Remember how you stacked an HTML tooltip layer over the SVG layer for the shapes? It's exactly the same idea, with just one more layer in the stack.
🔎 What your DOM will look like
Below is some pseudocode demonstrating the JSX structure of the graph component.
Oh no! 😱
It seems like you haven't enrolled in the course yet!
This is a lesson from the D3 ❤️ React course, where you learn to create bespoke, interactive graphs with d3.js and React.
Enrollment is currently closed. Join the waitlist to be notified when doors reopen:
Or Login