What is D3.js
D3.js is a powerful JavaScript library, but it's not a charting library. It's a toolkit with dozens of functions for bindingdata to visual elements.
This lesson explores what D3 is, where to find its documentation, and why it's become the backbone of bespoke, interactive data visualization on the web.
❌ Not a Charting library
It's important to understand that D3 is not a charting library.
A charting library would offer a ready-made Scatterplot component where you pass some properties, and it renders the chart for you.
D3 doesn't do that. It provides utility functions to help you create your scatterplot, but it won't build it for you.
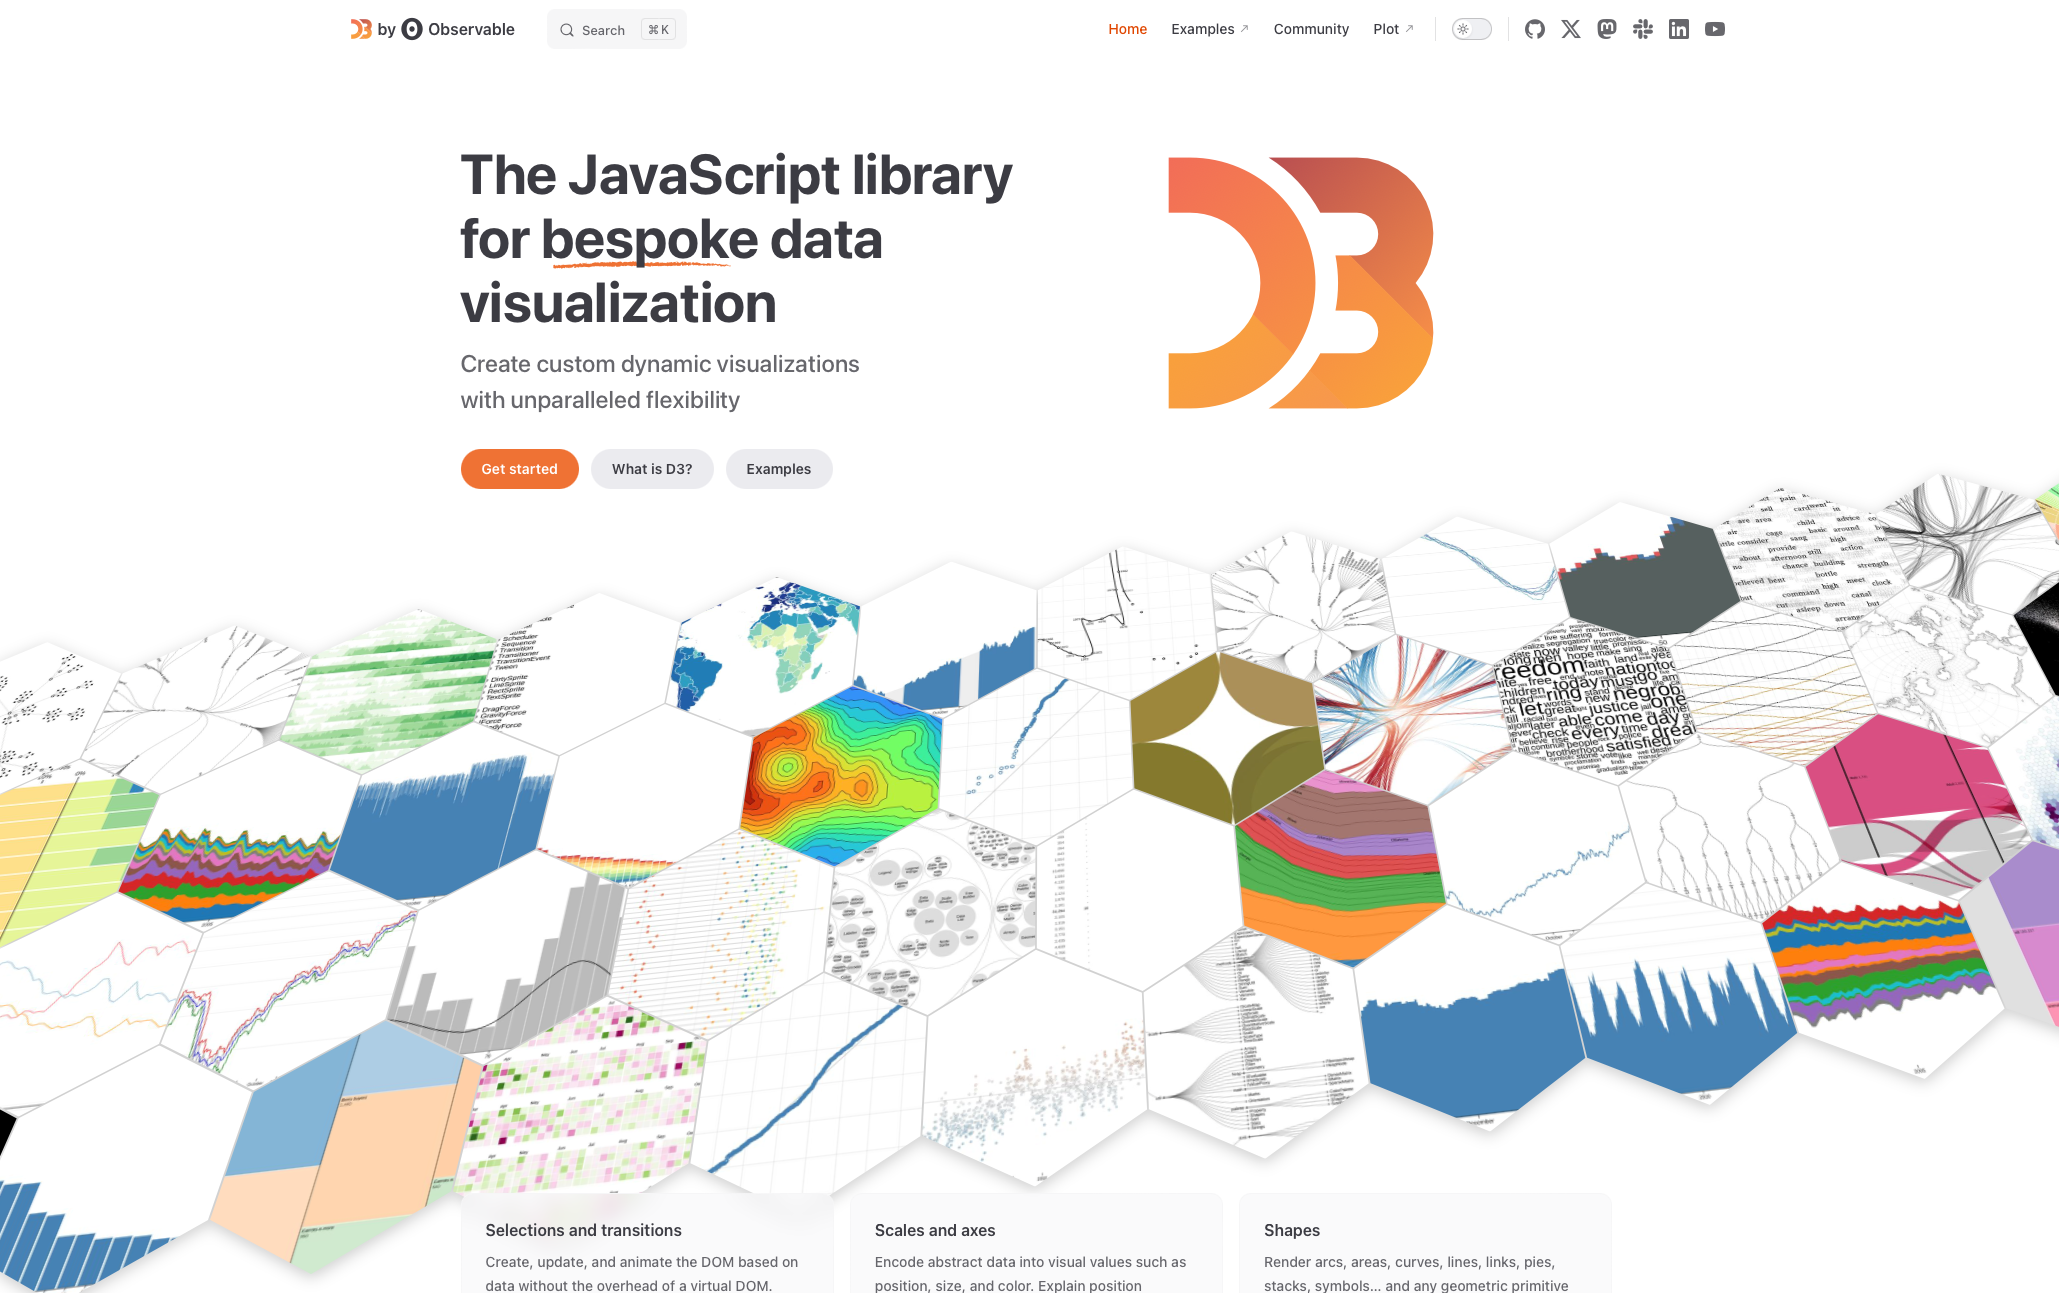
D3.js website screenshot.
✅ Why it's more powerful
Since your using low level functions that just do tiny specific tasks. As a result, d3 used together wht HTML, css, js and react becomes the most powerful stak. It allows to get customization and interactivity.
Bespoke graphs
Interactive graphs
🦴 Anatomy of d3.js
D3.js is basically a set of small utility functions. There are about xxx of them. They are split in x groups that we call modules.
Start scrolly-telling.
For instance, the scale module is very useful. We'll dedicate a full module of this course on it. It allows to translate data into position or colors.
Another module.
D3.js is open source. You can read every single line of its code on Github, and there is one repo for each module.
Oh no! 😱
This lesson isn’t available just yet.
Take a look at the status badges next to each lesson in the sidebar to see when it’s coming out.
Thanks for your patience! 🙏