Chart libraries: don't
99% of developers have the same instinct when it comes to adding a chart to a web application: reach for a JavaScript library that offers a pre-made chart component.
While that's a great starting point, it often leads to unexpected and painful complications. Let's explore why, and why D3 might be the cure.
⏱️ In a hurry
Here is a typical story from your life as a developer.
You're working on an impressive web page and you've been asked to add a barplot. The specs are nothing crazy! You'll need a few rectangles, one axis, some labels, and a title.
The good news?
There are plenty of JavaScript dataviz libraries that can handle this perfectly. They all offer a Barplot component you can call easily with a few props to fit your style. 🎉
Here is a list of the most popular options:
A charting library is a high-level tool that provides ready-made chart components (bar chart, line chart, pie chart...). You pass your data and a few options, and the library draws the chart for you.
Spoiler: D3.js is NOT a charting library.
Let's try with Nivo (I used it for a client recently).
All you have to do is npm install the lib, import its ResponsiveBar component, and use it with 3 required props: data, keys, and indexBy.
// Import lib
import { ResponsiveBar } from '@nivo/bar';

// Make a barchart
<ResponsiveBar data={data} keys={['value']} indexBy="country"/>
That's just 3 lines of code, and it gives a fantastic barplot! Your supervisor is probably thrilled to see how quick it was to build such a complex UI element.
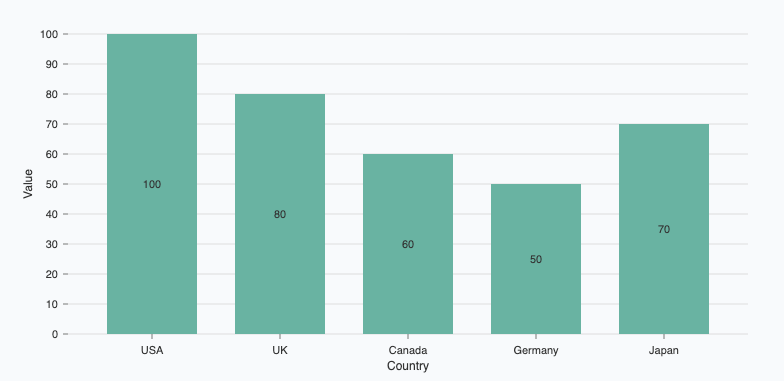
A basic barplot made using the Nivo library in 3 minutes.
Oh no! 😱
It seems like you haven't enrolled in the course yet!
This is a lesson from the D3 ❤️ React course, where you learn to create bespoke, interactive graphs with d3.js and React.
Enrollment is currently closed. Join the waitlist to be notified when doors reopen:
Or Login