User interactions
Drawing with canvas gives the best performance because it adds a single element to the DOM and draws into it blazing fast.
But that comes with a downside: how do you attach an onMouseOver or onClick handler to an element of your graph? You can't, and this lesson shows the workaround.
❌ The problem
Let's briefly recall how user interactions work on charts in a React application.
The course has many lessons on the topic, covering hover effects and tooltips. All of them rely on an internal state that is updated by an event handler attached to a graph element.
Take the example below. Three circles are displayed, and an interactionData state stores the circle currently hovered (or null when none is). Each circle has an onMouseEnter handler that updates this state, and the hovered circle's name is shown above the chart.
import { useState } from 'react';

const width = 460;
const height = 240;
const RADIUS = 35;

const data = [
  { name: 'A', x: 110, y: 120, color: '#e0ac2b' },
  { name: 'B', x: 230, y: 120, color: '#6689c6' },
  { name: 'C', x: 350, y: 120, color: '#e85252' },
];

export default function App() {
  const [interactionData, setInteractionData] = useState(null);

  return (
    <div style={{ fontFamily: 'system-ui' }}>
      <p style={{ height: 20, margin: '0 0 8px' }}>
        {interactionData ? `Hovered: ${interactionData.name}` : 'Hover a circle'}
      </p>
      <svg width={width} height={height}>
        {data.map((d) => (
          <circle
            key={d.name}
            cx={d.x}
            cy={d.y}
            r={RADIUS}
            fill={d.color}
            onMouseEnter={() => setInteractionData(d)}
            onMouseLeave={() => setInteractionData(null)}
          />
        ))}
      </svg>
    </div>
  );
}
But if we build the same example with canvas, we can't attach an onMouseEnter to a circle: it isn't in the DOM!
✅ The solution: hit testing
1️⃣ onMouseMove at the canvas level
The solution is to attach a single onMouseMove listener to the canvas element itself (that one is in the DOM).
<canvas
  ref={canvasRef}
  onMouseMove={handleMove}
  // width, height...
/>
The handler now fires on every move, with the mouse position. We use those coordinates to trigger a UI change. That's the job of the handleMove function.
See it live:
2️⃣ From screen to canvas coordinates
The first job of handleMove is to convert the cursor position into the canvas's coordinate system.
Here's a subtlety that trips everyone up. A mouse event gives you e.clientX and e.clientY, measured from the top-left of the browser viewport. But the shapes you drew are positioned relative to the top-left of the canvas. The two origins are not the same.
To bridge them, ask the canvas where it sits on screen with getBoundingClientRect(), then subtract its top-left corner:
const rect = e.currentTarget.getBoundingClientRect();
const x = e.clientX - rect.left; // cursor x, inside the canvas
const y = e.clientY - rect.top;  // cursor y, inside the canvas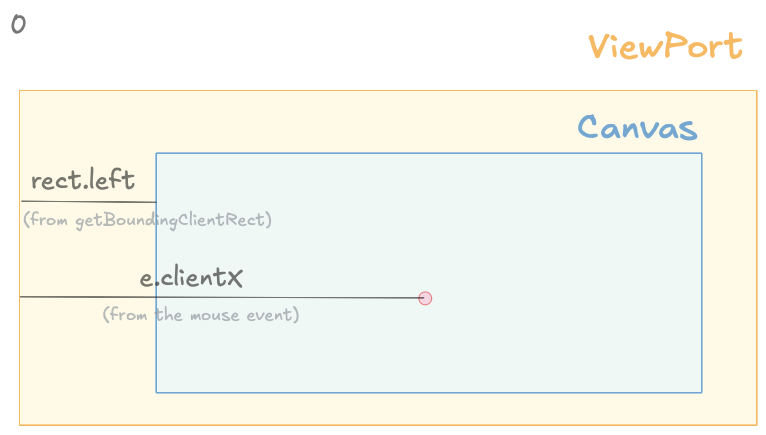
The event gives viewport coordinates; subtract the canvas's top-left corner to get coordinates inside the canvas.
Skip this step and the hover feels "off": the further the canvas sits down or to the right of the page, the more the highlight drifts from the cursor.
3️⃣ Is the cursor over a circle?
Time for the hit test itself. Now that we have the cursor in canvas coordinates, it's just geometry: a circle is hovered when the distance from the cursor to its center is smaller than its radius.
If a circle matches, we update the interactionData state and redraw. With the hovered circle known, highlighting it in the drawing code is straightforward.
import { useRef, useEffect, useState } from 'react';

const width = 460;
const height = 240;
const RADIUS = 35;

const data = [
  { name: 'A', x: 110, y: 120, color: '#e0ac2b' },
  { name: 'B', x: 230, y: 120, color: '#6689c6' },
  { name: 'C', x: 350, y: 120, color: '#e85252' },
];

export default function App() {
  const canvasRef = useRef(null);
  const [interactionData, setInteractionData] = useState(null);

  // Redraw whenever the hovered circle changes.
  useEffect(() => {
    const ctx = canvasRef.current.getContext('2d');
    ctx.clearRect(0, 0, width, height);

    for (const d of data) {
      ctx.beginPath();
      ctx.arc(d.x, d.y, RADIUS, 0, 2 * Math.PI);
      ctx.fillStyle = d.color;
      ctx.globalAlpha =
        interactionData && interactionData.name !== d.name ? 0.3 : 1;
      ctx.fill();
    }
    ctx.globalAlpha = 1;
  }, [interactionData]);

  // One listener on the canvas, then we find the circle ourselves.
  const handleMove = (e) => {
    const rect = e.currentTarget.getBoundingClientRect();
    const mx = e.clientX - rect.left;
    const my = e.clientY - rect.top;

    const found = data.find(
      (d) => Math.hypot(d.x - mx, d.y - my) <= RADIUS
    );
    setInteractionData(found ?? null);
  };

  return (
    <div style={{ fontFamily: 'system-ui' }}>
      <p style={{ height: 20, margin: '0 0 8px' }}>
        {interactionData ? `Hovered: ${interactionData.name}` : 'Hover a circle'}
      </p>
      <canvas
        ref={canvasRef}
        width={width}
        height={height}
        onMouseMove={handleMove}
      />
    </div>
  );
}
→ Back to normal
Notice what just happened: once the state holds the mouse position and the highlighted group, we're back to the usual React pattern.
From there, that state can drive any interaction you like: a cross-chart highlight, a tooltip, or any other piece of UI.
⏰ Performance matters
With canvas, the tricky part is often matching the mouse position to the chart's elements.
And you reach for canvas precisely when performance matters, which usually means thousands of points. At that scale, the lookup algorithm can quickly become a bottleneck if it isn't written carefully.
Take a heatmap. Even a modest 100 × 100 grid already holds 10,000 cells, and the demo below goes much further: 1000 × 800, or 800,000 cells.
A grid lookup turns the cursor position straight into a row and column with Math.floor(x / cellWidth), then reads the cell in a single array access: O(1).
A naive loop would instead walk through every cell on each move, testing its bounds: O(n). At 800,000 cells, that alone would bring the hover to a crawl.
import { useState } from 'react';
import * as d3 from 'd3';
import { Renderer } from './Renderer';
import { Legend } from './Legend';

const color = d3.scaleSequential(d3.interpolateViridis).domain([0, 1]);

export const Heatmap = ({ data, width, height }) => {
  const [hovered, setHovered] = useState(null);

  // Grid dimensions, derived from the data.
  const numCols = d3.max(data, (d) => d.col) + 1;
  const numRows = d3.max(data, (d) => d.row) + 1;
  const cellWidth = width / numCols;
  const cellHeight = height / numRows;

  // On a grid, finding the cell is instant: integer math gives the row and
  // column, and the cell is a single array lookup. O(1), whatever the size.
  const handleMove = (e) => {
    const rect = e.currentTarget.getBoundingClientRect();
    const col = Math.floor((e.clientX - rect.left) / cellWidth);
    const row = Math.floor((e.clientY - rect.top) / cellHeight);

    if (row < 0 || row >= numRows || col < 0 || col >= numCols) {
      setHovered(null);
      return;
    }
    setHovered(data[row * numCols + col]);
  };

  return (
    <div style={{ fontFamily: 'system-ui' }}>
      <Renderer
        data={data}
        width={width}
        height={height}
        cellWidth={cellWidth}
        cellHeight={cellHeight}
        color={color}
        hovered={hovered}
        onMouseMove={handleMove}
        onMouseLeave={() => setHovered(null)}
      />
      <Legend color={color} width={width} hovered={hovered} />
    </div>
  );
};
An 800,000-cell heatmap on canvas (1000 × 800). Hover to highlight a cell's row and column; the legend shows its value.
D3.js to the rescue
It's your responsibility to find the most appropriate detection algorithm. Fortunately, d3 comes with a bunch of handy functions:
Oh no! 😱
It seems like you haven't enrolled in the course yet!
This is a lesson from the D3 ❤️ React course, where you learn to create bespoke, interactive graphs with d3.js and React.
Enrollment is currently closed. Join the waitlist to be notified when doors reopen:
Or Login