Canvas vs SVG
SVG is wonderful until you ask it to draw too much. Every mark is a DOM node, and the browser pays for each one.
This lesson shows exactly why SVG slows down at scale, and why canvas, which paints pixels instead of nodes, is the way out.
❌ The Problem with SVG
This whole course is based on SVG for rendering geometrical shapes on our screen, building our graphs. It works well, you can build anything with it!
But SVG has a downside: performance.
When you draw a chart with SVG, every single element becomes a new line in your DOM. If you draw a scatterplot with 100k data points, you're actually building an HTML file with more than 100k rows in it. 😱
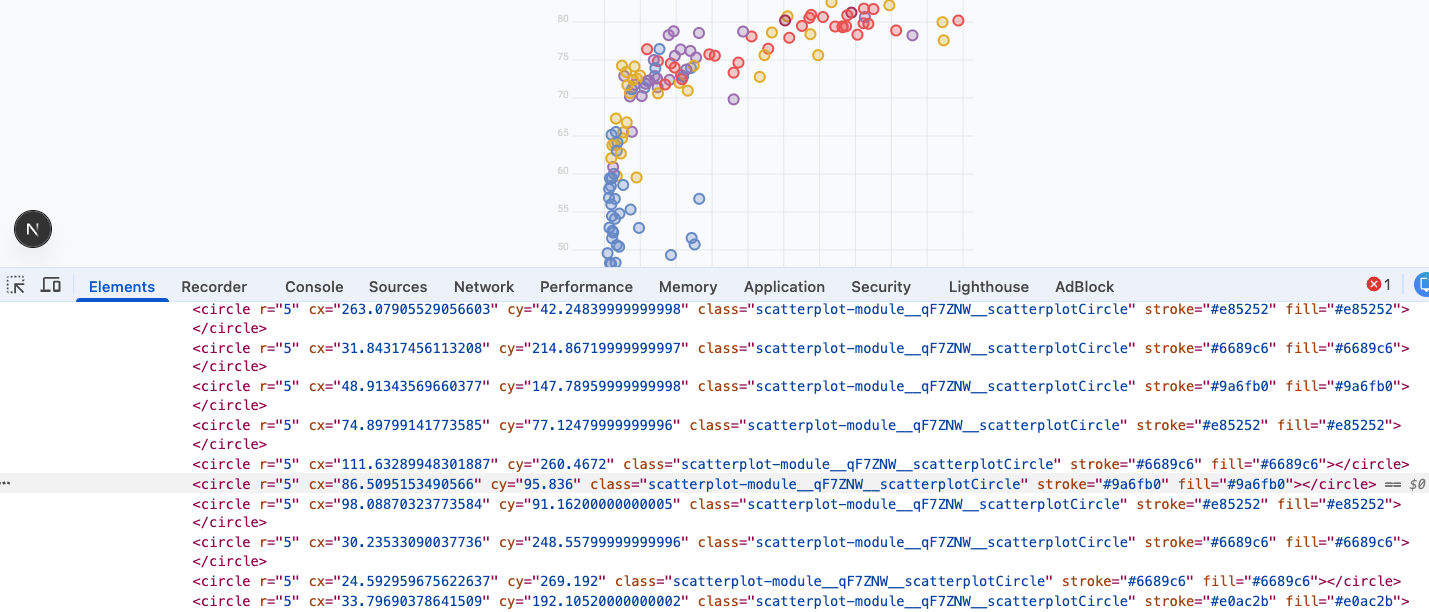
If you inspect a scatterplot, you'll probably see a crowded DOM like this, with heaps of circle elements.
Now add a hover effect that modifies all of them, and that's an insane amount of work and memory for your browser to deal with!
On top of that, SVG rendering relies entirely on the CPU, with no GPU acceleration.
This means every shape, line, or point in an SVG graphic is drawn by the CPU, which can quickly become a bottleneck.
🐌 Example
Here's a scatterplot with 100k data points. When the user moves the mouse, an internal state updates, which triggers a re-render.
All 100k data points have to be drawn again. Your browser struggles to handle such a large DOM, and the result is a sluggish chart that can slow your whole computer down.
import { useState } from 'react';
import { data, width, height } from './data';

export default function App() {
  const [hovered, setHovered] = useState(null);

  return (
    <svg width={width} height={height}>
      {data.map((d, i) => (
        <circle
          key={i}
          cx={d.x}
          cy={d.y}
          r={hovered === i ? 4 : 2}
          fill={hovered === i ? 'red' : 'blue'}
          fillOpacity={0.4}
          onMouseOver={() => setHovered(i)}
        />
      ))}
    </svg>
  );
}
✅ The solution: Canvas
Canvas is an entirely other way of drawing on a screen. A whole new paradigm with its pros and cons.
Canvas is actually an HTML element. It looks like this in your DOM:
<canvas width={300} height={200}/>Once the canvas element is rendered, we'll write a set of instructions to draw in it. It's a bit like setting up a white board with dimensions in our application, and then draw stuff on it.
The magic here is that only one single node is added to our DOM, even for 100k data points! Check this screenshot where I inspect the canvas version of the sluggish scatterplot above: just 1 single line with a canvas element!
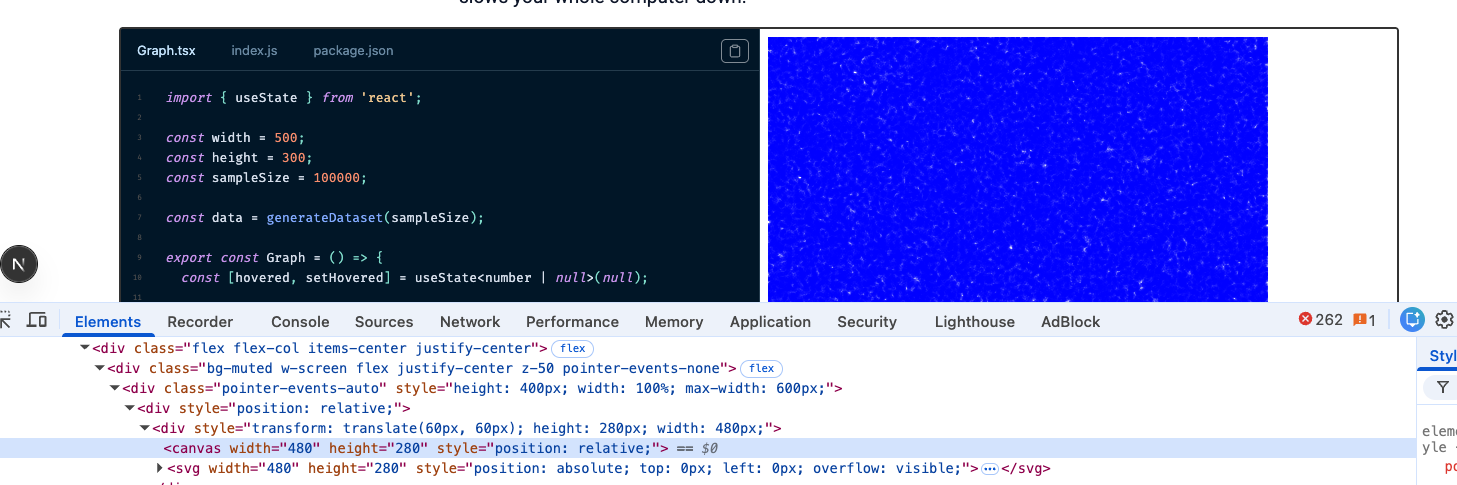
The same scatterplot drawn with canvas: a single canvas node in the DOM.
On top of that, canvas is lightning fast to draw. Instead of creating and laying out thousands of DOM nodes, the browser simply paints pixels onto a single bitmap, a job it can hand off to the GPU. There is no layout, no reflow, no per-node bookkeeping: just raw drawing.
So with a very light DOM and great drawing performance, canvas is the tool of choice for dataviz projects with performance constraints.
→ 🐌 fix:
Oh no! 😱
It seems like you haven't enrolled in the course yet!
This is a lesson from the D3 ❤️ React course, where you learn to create bespoke, interactive graphs with d3.js and React.
Enrollment is currently closed. Join the waitlist to be notified when doors reopen, and get 3 free lessons right away:
Or Login