Building shapes with d3
Some shapes can be quite complex—like rings, slices, paths, polygons, and curves. Manually creating the d attribute for these shapes (like in the previous lesson) would be a nightmare!
Fortunately, D3 provides a module called d3-shape specifically for handling all these shapes. Let's explore how it can simplify our work.
📐 Building the line you need
In the previous lesson we introduced the path element, and showed that a line chart is basically rendered this way:
<svg height="300" width="400">
  <path
    d="M0 105 L100 200 L200 200 L300 20 L350 120"
    fill="none"
    stroke="#69b3a2"
  />
</svg>
Fortunately, D3 includes a module called d3-shape that offers helper functions for building shapes. These functions take your data and automatically generate the d attribute for a path!
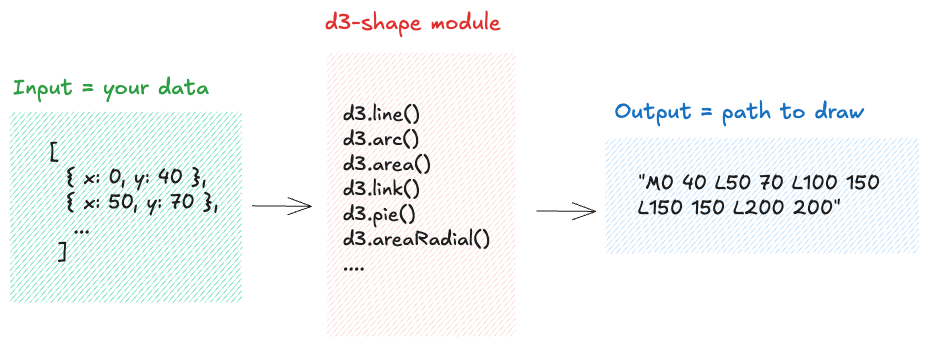
d3-shape fixes the pain described in the path lesson.
Now, let's explore in depth how to use the d3.line() function to create the path for a line chart, step by step.
const data = [
  { x: 0, y: 40 },
  { x: 50, y: 70 },
  { x: 100, y: 150 },
  ...
];
Everything begins with a data object, which is almost always an array.
Each item in the array represents a data point and is usually an object with properties.
For a line chart, you'll need at least two properties: one for the x-axis position and one for the y-axis position (x and y here).
Oh no! 😱
It seems like you haven't enrolled in the course yet!
This is a lesson from the D3 ❤️ React course, where you learn to create bespoke, interactive graphs with d3.js and React.
Enrollment is currently closed. Join the waitlist to be notified when doors reopen:
Or Login